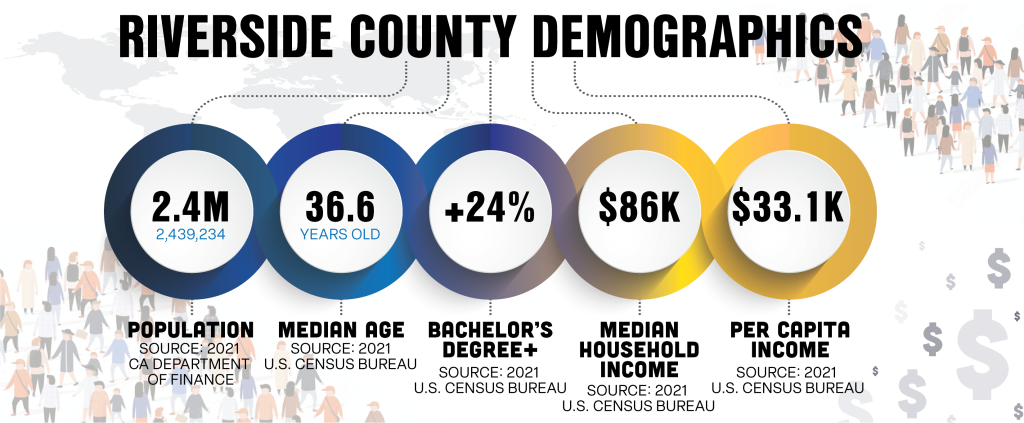
Riverside County Demographics Highlights
Economic Indicators
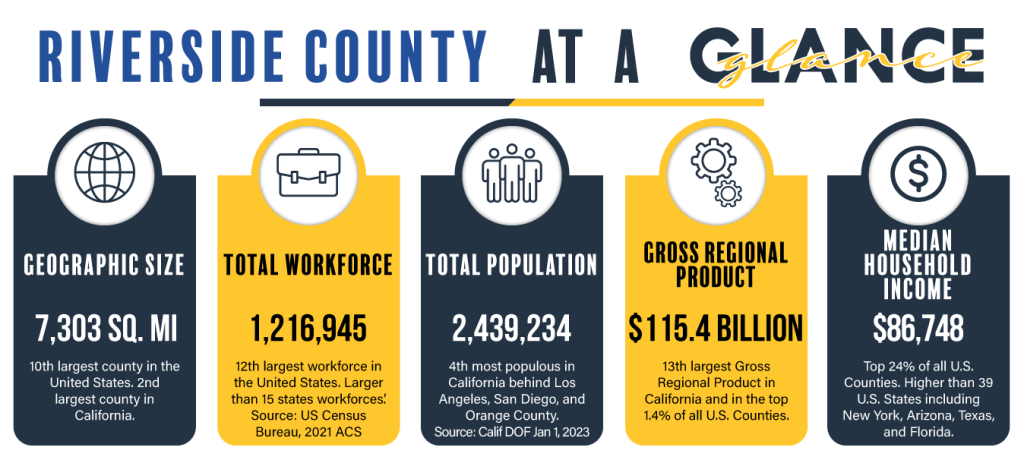
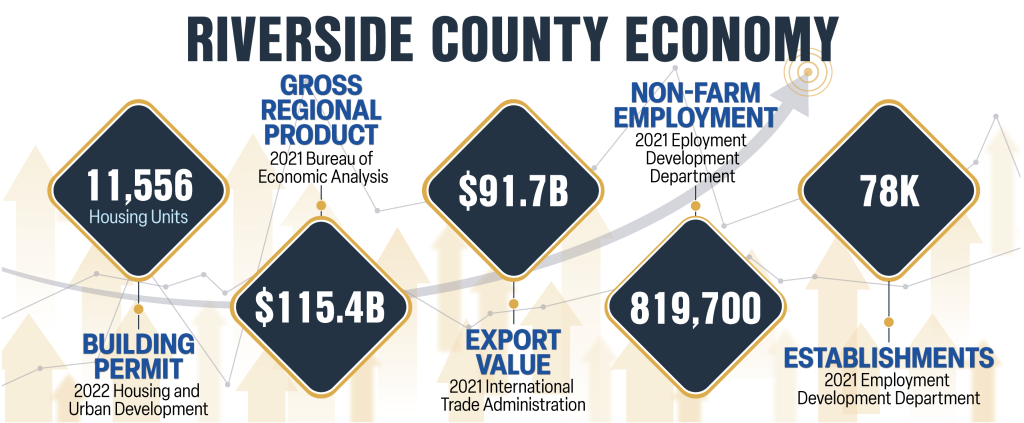
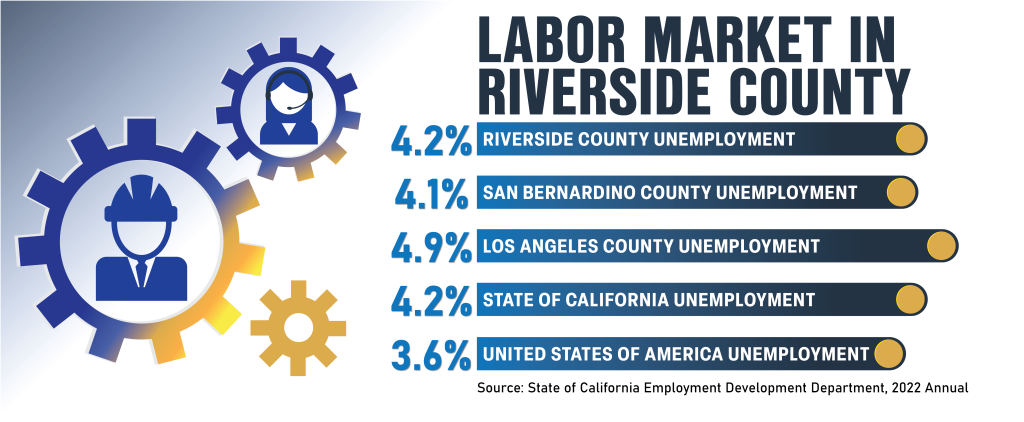
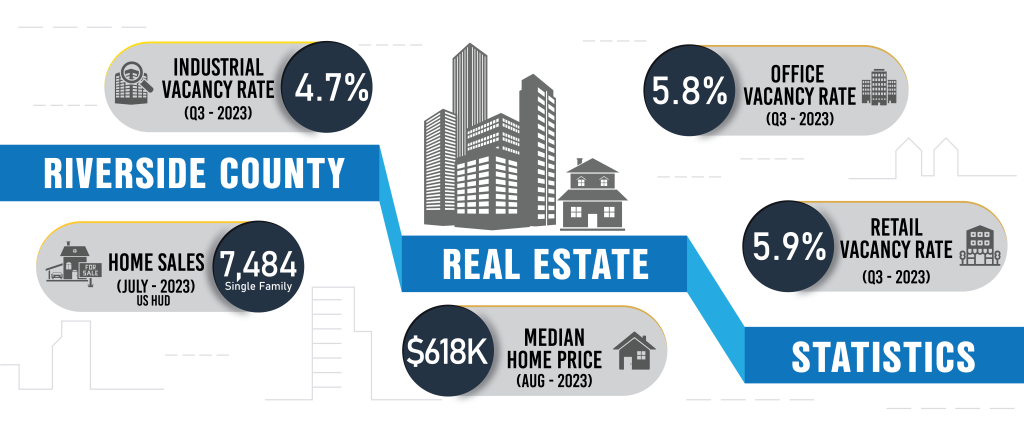
These indicators provide a general breakdown explaining the characteristics of the human population and population segments. The economic indicator help identify consumer markets and provide current population trends. The Demographics Division compiled various reports to help business and public agencies plan for the future and make educated decisions on future growth and investment. This information can be beneficial to companies and governments in defining the demand or need for specific products and services in the area.
For customized demographic reports for any community or city in Riverside County, visit RivCoSites.com
Create numerous additional reports by visiting the RivCoSites webpage. Be confident in the most up-to-date demographic information sourced from Esri.
- Discover the features in this powerful mapping tool to get up-to-date demographic information about the workforce, income, housing, and more.
Riverside County GDP Comparison Chart
Riverside County's GDP comparison chart reveals the economic dynamics and growth patterns within the region. The chart showcases the county's economic performance over a specified period, comparing its Gross Domestic Product (GDP) to previous years or neighboring areas. This analytical tool allows policymakers, businesses, and residents to gain insights into the county's economic health, identifying sectors that contribute significantly to its GDP and those that may require attention. By examining trends and fluctuations, stakeholders can make informed decisions to foster economic development and address challenges. The GDP comparison chart serves as a valuable resource for strategizing and planning initiatives that aim to strengthen Riverside County's economy and enhance the overall well-being of its communities.

