

Emerging Technologies
Biotech, health care, and renewable energies combined make up over 5,000 establishments in the county. The emerging technologies sector experienced a 24% growth in the number of establishments and a 12% growth in employment from 2nd Qtr 2019 to 2nd Qtr 2024. These fields employ over 77,000 people.
This interactive map highlights businesses across key life science and advanced industry sectors, including Renewable Energy, Biotechnology, Health Care, and Manufacturing. Each point represents a business location and can be clicked to view a pop-up with relevant details. Layers can be toggled on/off in the layers pane to customize the map view.

Manufacturing
In 2023, manufacturing contributed $7.4 billion to the county’s GDP (6%). In 2024, manufacturing employed 44,445 people across 1,841 establishments. Business establishments grew by nearly 5% from 2021 to 2024, while the average weekly wage increased by 10%.
This interactive dashboard displays the locations of manufacturers throughout Riverside County. Each point represents a business location. Clicking on a point opens a pop-up with additional details and automatically updates the Employee Count infographic.

Retail/ICSC
Retail trade produced nearly 10% of the county's total GDP, generating over $12 billion in 2023. In 2024, retail employed 94,000 people across nearly 5,500 establishments in Riverside County. From 2021 to 2024, employment grew by 3%.
This interactive dashboard was originally designed for use at the ICSC Las Vegas Conference. ICSC Las Vegas is the world's largest, annual commercial real estate gathering. By selecting any community from the Search Tool, it will automatically zoom and pan to that location, displaying a detailed pop-up, and up-to-date infographics for Retail Demand and Total Population. Users can also type any Riverside County community directly into the Search Tool to navigate.

Tourism
Riverside County’s tourism-related industries employed 94,690 people in 2024, while direct travel spending by visitors amounted to nearly $10 billion, growing 3.0% from 2023 to 2024.
Riverside County’s tourism-related industries employed 94,690 people in 2024, while direct travel spending by visitors amounted to nearly $10 billion, growing 3.0% from 2023 to 2024.
This dashboard showcases businesses in the Hospitality & Tourism industry. Each point represents a business location and can be clicked to display a pop-up with relevant information.

Healthcare
In 2024, healthcare employed over 84,000 individuals across 5,018 establishments. From 2021 to 2024, employment grew by nearly 22%.
This dashboard displays businesses within the Healthcare industry. Each point represents a business location and can be clicked to access a pop-up with key information.

Foreign Trade Zones
As part of the two-county Riverside-San Bernardino-Ontario MSA, the area ranked as the 36th largest exporter in 2024 with over $11 billion in total exports. Both Computer/Electronic Products and Miscellaneous Manufacturing produced over $2 billion each in 2024. Riverside County alone accounted for $4.9 billion in exports.
This dashboard provides an interactive map of Riverside County featuring primary and secondary freeways, designated Foreign Trade Zones, and nearby airports and ports. Each FTZ can be clicked to display its corresponding FTZ code.


Gross Domestic Product (GDP)
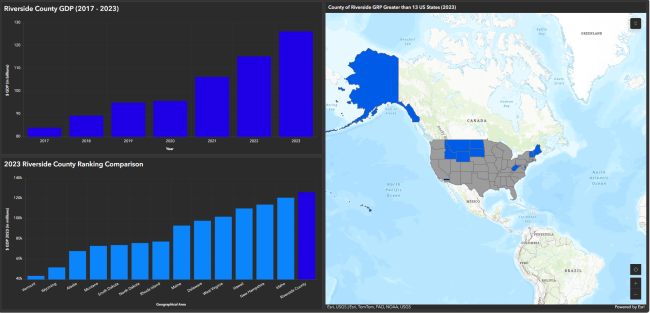
Riverside County's 2024 GDP was $135 Billion in current dollars, a 6.7% increase in GDP from 2023-2024, an increase of over $8 billion since last year. The state rate of increase was 3.7% from 2023 to 2024. Riverside County has the 9th largest GDP of all counties in California and ranks in the top 1.4% of all U.S. counties.
This dashboard reports Riverside County’s GDP compared to all states with a lower GDP, covering the period from 2018 to 2024.
Unemployment Rate by the Numbers
Riverside County Unemployment Dashboard
This interactive dashboard provides a visual overview of unemployment rates across Riverside County. Users can explore current unemployment levels and compare trends over time. The dashboard is designed to support data-driven decision-making by making labor market conditions easy to understand at a glance for policymakers, staff, and the public.